
One of the many joys of being Symplectic’s CEO is getting a “sneak peek” at new Elements features
whilst they are still in development.”
A bit of background
When not doing CEO things – attending gala dinners, playing golf and other stereotypical things I never get asked to do – I spend a good amount of my time either thinking about, talking about or using Symplectic Elements.
Symplectic also has a wonderful community of practitioners that often do the same, albeit from the perspective of a research organisation and hopefully not at weekends! When demo-ing Elements I’m often asked:
- “Can Elements help my organisation visualise levels of collaboration with external institutions and authors?”
- “Can Elements help visualise levels of engagement with our Open Access Policy?”
- “Can Elements help us better understand the up-take of ORCID at our institution by Department and/or discipline?”
As you’d expect me to say – I am the CEO – the immediate answer to all of the above is of course “yes” (phew), but with a set of important caveats e.g. “yes, but it depends on how your organisation has configured Elements and/or “yes, but it depends on how your organisation has adopted Elements as that informs the type of data your Elements system will hold”.
In addition – and this is the focus of this blog – the route to adding an entirely new visualisation to Elements currently either relies on the Symplectic team adding a visualisation to our product roadmap or our clients being able to use our current reporting toolset – which requires a reasonable amount of coding know-how.
Our clients can also make use of open source tools such as VOSViewer and VIVO to visualise their research data or simply export data in .csv format for manipulation in tools such as MS Excel or Google Sheets. Whilst our larger clients often have access to their own Business Intelligence tools licensed separately to Elements such as Tableau and OBIEE; which can be set-up to use Elements as a data source for internal reporting needs.
So, “yes”, but for many of our clients there’s also the extra challenge of gaining access to ‘technical’ staff typically assigned to other enterprise level projects.
It was with this background that I rather excitedly logged in to a pre-release version of Symplectic Elements v5.19.
What’s new?
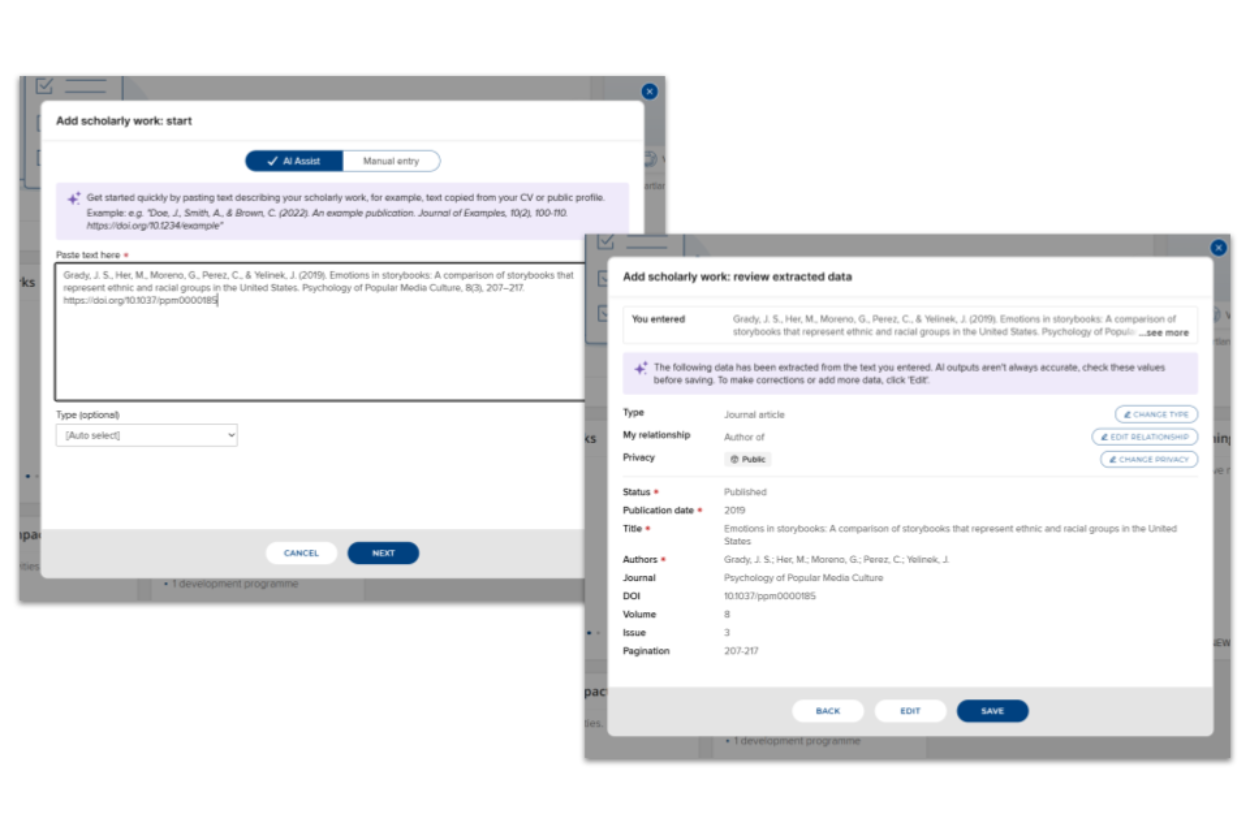
Much to my delight – and I’m pretty sure I won’t be alone – the next version of Elements will include two new important features:
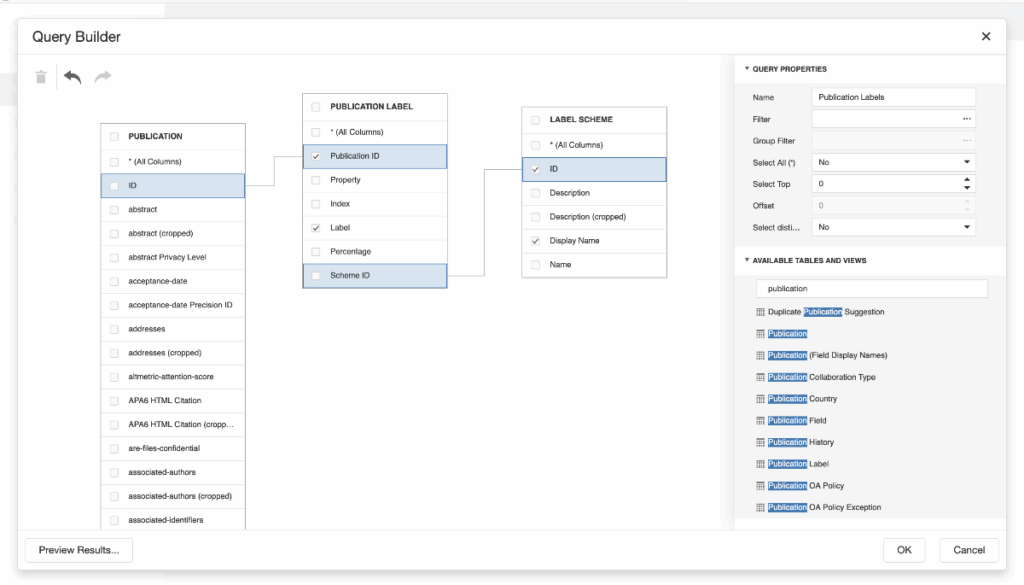
- A browser-based query builder to allow those without programming experience to create queries and reports on data contained in their Elements system
- A browser-based dashboard design tool that allows authorised users to design and subsequently share inside Elements, graphical and tabular visual reports with drill-up and drill-down interactivity.
Rather wonderfully, this is a feature set that will be made immediately available to over 60% of our client-base as it will form part of their existing licensing of Elements.
Here’s one I made earlier!
I should add at this point that I do have a programming background but in a previous role I was once responsible for training staff in the analysis of data using an ad hoc query tool, so given that experience, I wanted to test whether our new dashboarding features could be used by those with absolutely no programming experience (which is often the case within research administration).
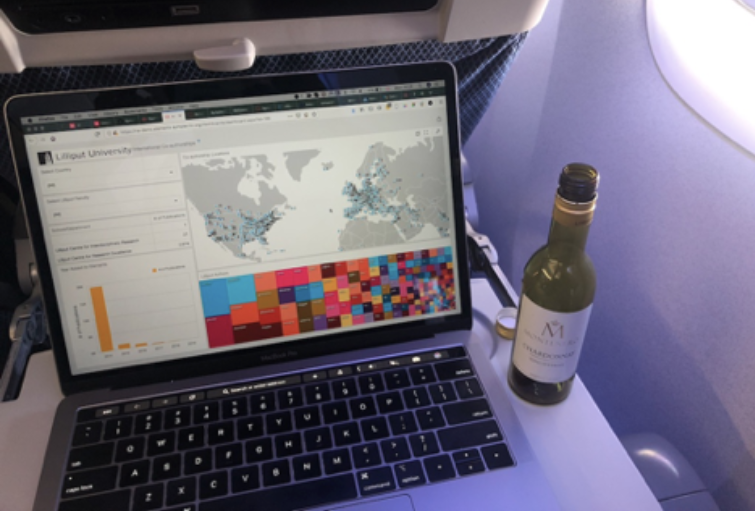
As per the image at left, one of my early dashboards was developed 35k ft in the air and accompanied by a modest bottle of Chardonnay, but these are not official prerequisites! Instead, all dashboards currently source their data from one or both of two supported dashboard data sources: the Elements Reporting Database and the Elements Analytics Database. Both of these databases must be installed in order for all dashboards to function correctly.
My first dashboard made use of GRID data (which includes institutional longitudinal and latitudinal data) included in Elements for subscribers of the Dimensions data source. It also makes use of user data held in Elements that has been automatically linked to publications captured in our demo system.
The great thing with this particular dashboard was that I was able to make it interactive, and so clicking on one of the blue dots included in the map (which represent a research organisation contained in GRID) re-plots the other visual components contained in the dashboard.
As a reminder, this is a dashboard that was created within my browser (on a plane!) and the configuration of the different panes on the dashboard was set by me as I had assigned my account as a Dashboard Administrator of our Elements demo system.
Rapid prototyping
Since first getting my hands on a pre-release version of Elements v5.19, I’m rather proud to say that at least one of my early prototypes has now been ‘productionised’ by our Development team for inclusion in our v5.19 release next week.
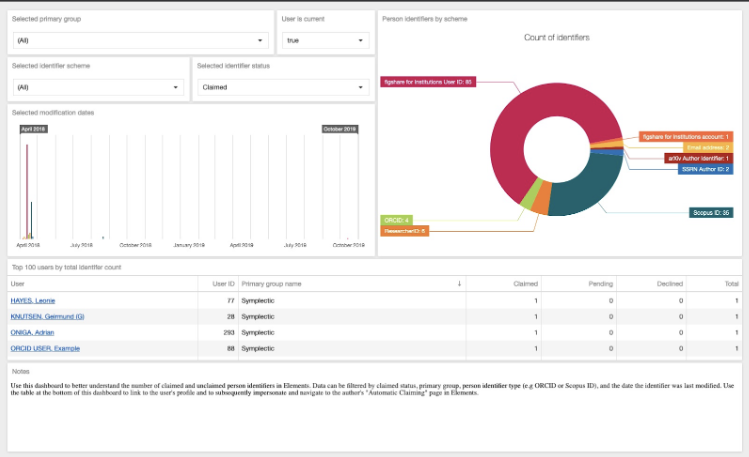
Again, all of the data is sourced from within a single Elements system and in the above screenshot you can see that I was able to visualise the number of person identifiers that have been positively associated (or ‘claimed’) by active users of our Elements demo system. You can also see that I added filters to allow users of the dashboard to limit the data to selected Primary Groups (Departments) and/or to selected identifier schemes.
Unfortunately, our demonstration data doesn’t quite do the timeline visualisation justice, but the donut on the right reveals that at least 85 Figshare for Institutions user IDs have been ‘claimed’ by users of our demo system (as part of our RT2 integration) as well as 4 ORCIDs, 6 Researcher IDs and 35 Scopus IDs.
Once deployed in ‘the real world’, I very much hope this dashboard will help those responsible for overseeing the automatic linking of publications to user accounts in Elements. e.g. if a user has >1 pending Person Identifier then this may help identify a problem with the user’s publication search settings or indeed, reveal that they weren’t aware that publications contained in Elements can be automatically linked to their account were they to ‘claim’ their ORCID. To assist, the hyperlinks to each user’s name link back to the user’s Elements profile, from where identifiers can be ‘claimed’.
With great power comes great responsibility
When both designing custom dashboards and configuring access to them, it will be critical for our clients to ensure that they are meeting the requirements of their organisation’s privacy policy, including observing the privacy preferences indicated by users of the system. Mindful of this, clients that upgrade to Elements v5.19 will be directed to our Support Site which will provide guidance on the secure consumption of data in custom dashboards and on how to manage the appropriate sharing of access to dashboards within Elements.
The Elements dashboard designer and browser-based query builder also supports the use of custom SQL queries authored by the user designing the dashboard. As such, it will be possible to design inefficient dashboards or craft inefficient SQL queries whose execution may negatively impact the performance of the system as a whole. Our clients will therefore also need to ensure that the users they allow to manage dashboards are mindful that they will become, in effect, auxiliary developers of the system, and as such they will need to take on responsibility for the performance of their dashboards.
Happy CEO
I cannot stress how excited I am about our new reporting features; not only because the tool is so easy to use, but the way in which we have implemented it will allow our clients to get even closer to the rich and often unique data captured in each Elements system. So, in no particular order, here are my personal highlights:
The addition of a browser-based query tool will allow those that find our rather excellent, but lengthy, database documentation “a bit difficult to digest” a chance to preview data contained in each of the tables contained within the Elements Reporting Database. In doing so, they will become a lot more familiar with what data is typically there and not there when preparing a visualisation. For example, our reporting database can hold citation information sourced from different data sources, but not all data sources index the same journals, so citation data can vary between sources. This is a lot easier to see when previewing a table of publications captured from multiple data sources by Elements.
I really liked the ease by which I was able to use the dashboard design tool to create visualisations of data contained in Elements. In almost all cases, the initial visualisations were not quite what I expected due to the poor quality of our demonstration data, but the toolset allowed me to quickly refine the underlying query that the visualisations were based upon (e.g. exclude records with missing data). Again, this will be empowering for clients that don’t have direct access to programmers that can look at database tables in the Elements Reporting Database.
I was able to export a dashboard definition (XML file) from one Elements system to my desktop and then import that same dashboard definition into an entirely different Elements system with minimal effort. This is something I really hope our clients will take full advantage of as they get more comfortable with the toolset and we will certainly encourage our early adopting clients to share some of their early creations with other members of the Elements client community via our Symplectic figshare community portal.
Looking ahead…
As we move in to 2020, we plan to include functionality that will provide much richer opportunities to embed both stock and custom dashboards throughout the Elements user interface, such as the main researcher landing page.
In the meantime, I look forward to seeing the types of visualisations our clients develop after upgrading to Elements v5.19 in the New Year … including, I hope, a few “sneak peeks” at our first user meeting of the year in Melbourne on 18th February 2020.
Until then, happy visualising!
JB