
Symplectic Elements provides highly configurable reporting tools to track and analyse research activities, allowing you to see trends, track progress, and demonstrate compliance or engagement levels.
Demonstrate impact and gain actionable insights
Highly configurable reporting tools allow you to track and analyze all of your research activities, letting you see trends in research outputs, funding and citations; compare year-on-year figures and track progress against strategic objectives; and demonstrate compliance with government mandates and research impact or open access policies.

Reporting that works for you
To put you in complete control, we provide a specialist SQL-based reporting database which supports direct SQL querying, integrated SSRS reporting and further analysis using the business intelligence tools of your choice.
Reports can be provided as formatted reports, visual dashboards or CSV extracts, making it easy to access your data in a way that works for you. User permissions can easily be managed to make sure different institutional roles have access to the data that is most useful to them. You can write your own custom report templates using SSRS, or our specialist team can work with you to create them on your behalf.

“We could use the system for reporting across a number of different faculty activities and evaluations. That made the product immediately critical for a number of faculty processes.”
Stock or custom reports
Save time with our out-of-the-box dashboards and data extracts, available at the click of a button, or register custom reporting templates to your institution’s specific requirements. Stock reports include formatted CVs and biosketches, publication summaries, user profile completeness, ORCID identifier user, REF data quality, and more.

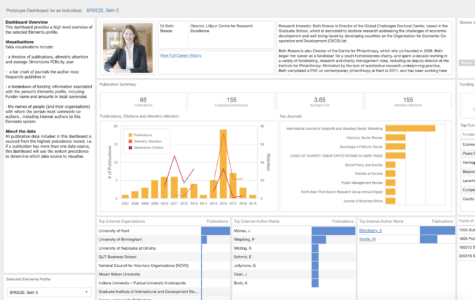
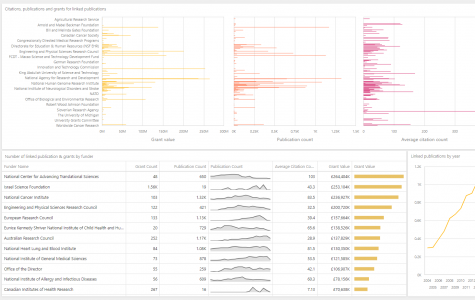
Dashboards
Interactive visualizations of aggregated data from across Symplectic Elements.

Formatted reports
Produce reports in a variety of formats. Suitable for intermediate data volumes.
Data extracts
Extract large volumes of data in CSV format using SQL scripts.
Reporting made easy
To put you in complete control of your reporting, Symplectic Elements provides each of our clients with a specialist SQL-based Reporting Database which is continuously updated. This supports direct SQL querying but also allows you to analyse your data using the business intelligence tools of your choice.
We also offer integrated SSRS reporting, empowering our clients to create their own custom reports which can be generated directly within the Symplectic Elements UI. You can use our standard templates, write your own, or have our team of experts create custom templates for you. Our reporting functionality supports a wide range of data types and formatting options including dashboards, data extracts, spreadsheets, CVs, group activity reports or formatted lists of outputs and activities. You can even add visualizations such as charts, graphs, co-authorship or collaboration diagrams and maps.
Discover Symplectic
Learn more about our products and request a free, no-obligation demo.